The Situation
The podiatry practice was already running paid advertising with a set budget and a reporting dashboard that tracked leads, calls and appointments.
The practice wanted to keep its spend steady. It wanted the existing budget to bring in more inquiries from patients looking for foot and ankle care, and it wanted to see clearly how many of those inquiries became appointments.
What We Changed
We optimized the practice’s existing campaigns rather than adding spend. In practice that meant reviewing which searches and audiences the ads were reaching, tightening the campaigns toward the services patients actually book, improving the pages inquiries land on, and making sure every call and form submission reached the front desk and was counted.
Leads and booked appointments were kept as separate measures throughout, so the practice could see both campaign response and what it turned into.
The Result
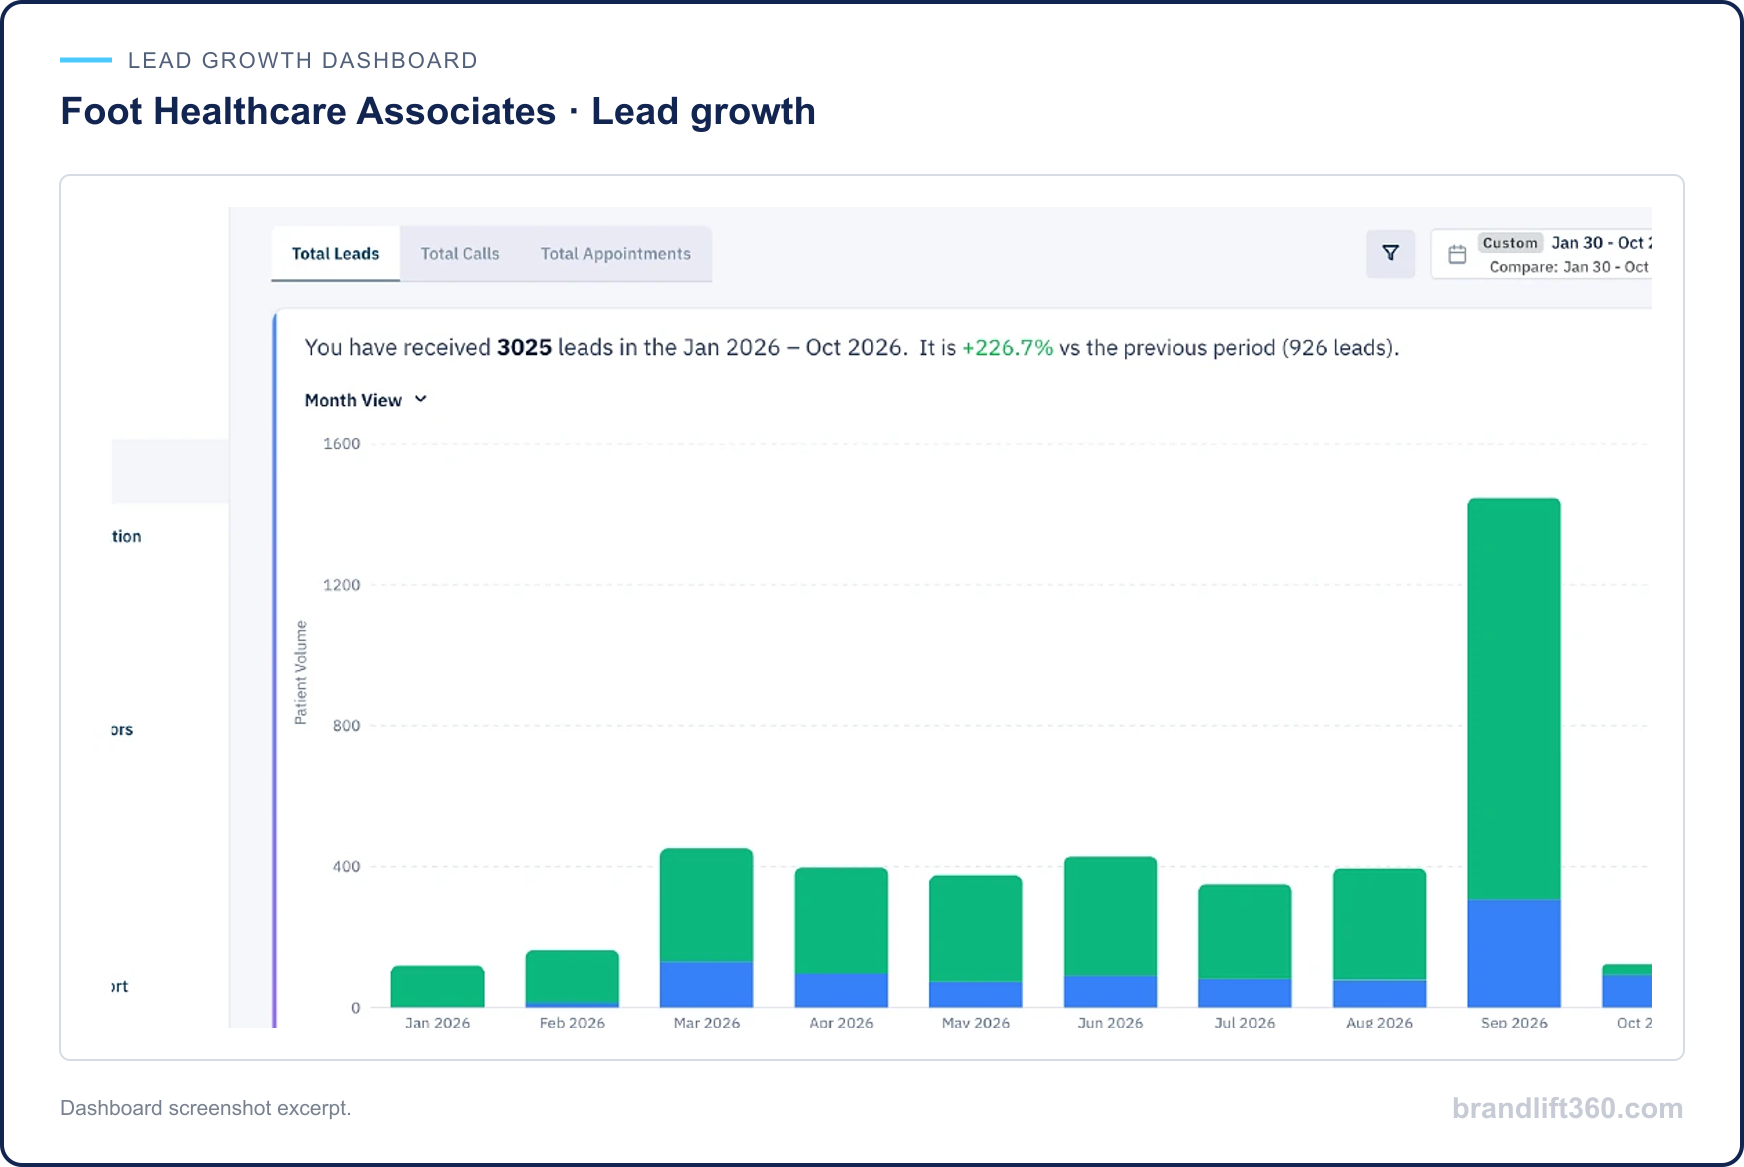
In its January–October 2026 view, the dashboard reports a 226.7% increase in total leads over the previous period, with the same advertising budget. With spend held steady, that works out to each lead costing roughly 69% less, a figure that is simple arithmetic rather than a number reported by the ad platform.
This result reports leads. Booked or attended appointments and revenue are measured separately, and monthly volume varied across the period.
Learn more on our paid advertising service page and our podiatry marketing page.
What We Measured
By the dashboard’s count, the practice received more than three times as many inquiries as in its comparison period. Leads and booked appointments are separate measures; we track both to understand how campaign response translates into appointments.
At a Glance
Specialty: podiatry (foot and ankle care).
Channel: paid advertising.
What changed: optimization of the practice’s existing campaigns.
Advertising budget: unchanged.
Period: January–October 2026, compared with the dashboard’s previous period.
Result: 3,025 leads versus 926 (+226.7%).
What It Means for Cost per Lead
With the advertising budget held steady, more than three times as many leads means each lead cost roughly 69% less than in the comparison period. That figure is simple arithmetic: the same spend divided across more than three times as many leads. It is a calculation, separate from the numbers the ad platform reports.
How Leads Are Counted
The practice’s dashboard reports total leads, total calls and total appointments in separate views. This result uses the total-leads view. Booked appointments are reported on their own, so a rise in inquiries is reported as inquiries and a rise in patients is reported separately.
What This Result Covers
The result covers total leads. Booked or attended appointments, revenue and the effect of seasonality are reported separately. Monthly lead volume varied across the period, with the largest month in September 2026. The end date of the comparison period is cut off in the dashboard capture, so we report the totals exactly as the dashboard shows them.
How We Would Start With Your Practice
We begin with a 15-minute call about the services you want to grow. Then we look at your current campaigns, landing pages and how inquiries reach your front desk before recommending any change in spend. Paid advertising is included in the Growth and Authority plans.
Questions Practices Ask About This Result
Did the advertising budget increase? The budget stayed the same; the campaigns were optimized.
Are these leads new patients? These are leads, meaning inquiries such as calls and form submissions. Booked appointments are tracked separately.
Will my practice see the same increase? Every practice’s outcome is its own and depends on its market, services, starting campaigns and follow-up.
Results depend on your market, services, starting campaigns and follow-up, and are not guaranteed.